
Mathematical Literacy and Financial Decision-Making among Undergraduate Students in Nigeria: Evidence from Selected Universities
Abstract
This study empirically investigates the relationship between Mathematical Literacy (ML) and Financial Decision-Making (FDM) among undergraduate students in Nigerian universities. While existing literature heavily isolates conceptual Financial Literacy (FL) as a primary driver of financial well-being, this study addresses an empirical gap by analyzing the quantitative cognitive assets required to apply that knowledge effectively. Utilizing an ex-post quantitative research design, structured questionnaires were administered to a stratified, multi-stage random sample of 500 undergraduate students across selected public and private universities in Nigeria, yielding 472 fully valid responses. Data were analyzed using Ordinary Least Squares (OLS) multiple linear regression analysis. The empirical results reveal that ML has a highly significant positive impact on FDM (β1 = 0.284, p < 0.001), exerting a stronger predictive influence than general FL (β2 = 0.195, p < 0.001). Among the socio-demographic control variables, higher disposable income, male gender, and advanced level of study also statistically improve financial choices, whereas chronological age exhibits a negligible effect. These findings indicate that abstract financial concepts are insufficient without foundational numeracy skills to navigate non-linear financial instruments. It is recommended that the National Universities Commission (NUC) integrate applied ML into the compulsory General Studies (GST) curriculum across Nigerian universities.
Keywords:Financial decision-makingHigher educationHuman capital theoryMathematical literacyUndergraduate students
1. Introduction
1.1 Background to the Study
In an increasingly complex and digitized global economic ecosystem, the capacity of individuals to navigate financial markets, evaluate investment portfolios, and prudently manage personal resources has become paramount [1]. Historically, basic financial practices required only elementary knowledge of banking operations. However, contemporary financial instruments exhibit profound architectural sophistication, requiring individuals to manage short-term consumption shocks alongside long-term investment strategies [2]. For undergraduate students, this landscape is particularly challenging. They operate at a critical developmental junction, transitioning from parental financial dependency to complete financial autonomy [3]. The microeconomic behaviors they establish during their undergraduate years often serve as permanent baseline habits that govern their long-term wealth accumulation, debt management, and socio-economic mobility [4].
Crucial to this dynamic is Mathematical Literacy (ML) defined not merely as the rote memorization of computational arithmetic, but as the comprehensive ability to identify, understand, and engage with mathematics to make well-founded judgments and decisions required of constructive, concerned, and reflective citizens [5]. In economic terms, ML serves as the cognitive framework through which financial concepts are parsed [5]. Financial products possess complex, non-linear pricing structures, including compound interest, amortized debt schedules, and probabilistic risk-return trade-offs [6]. Without a strong foundation in ML, a student's capacity to process numerical financial information is fundamentally compromised, leading to sub-optimal choices.
In developing economies like Nigeria, these dynamics are intensified by distinct structural changes and macroeconomic challenges. The financial sector has experienced dramatic shifts, characterized by rapid fintech integration, an increase in alternative non-interest financing options, and a rise in sophisticated retail investment platforms [7], [8]. Concurrently, Nigeria’s economic climate, marked by inflationary volatility, currency fluctuations, and shifting labor market returns, places a heavy burden on young adults to manage financial risk [9]. Despite these systemic shifts, institutional structures within the higher education sector have historically treated quantitative reasoning and financial planning as separate fields [10]. This creates a critical research gap regarding how mathematical competence directly translates into rational microeconomic behavior among Nigerian youth.
1.2 Statement of the Problem
Undergraduate students in Nigerian universities are increasingly vulnerable to poor financial outcomes [9], [11]. These include high levels of high-interest peer-to-peer debt, impulsive spending driven by digital consumerism, and exposure to digital financial scams [8]. While many studies isolate Financial Literacy (FL) as the primary determinant of financial well-being [1], [6] this view ignores the underlying quantitative skills required to apply that knowledge [5]. FL information remains abstract without the mathematical ability to compute compound interest rates, evaluate the real value of investments against inflation, or quantify risk via variance calculations [12].
Furthermore, existing empirical research in Nigeria often focuses on Small and Medium-Scale Enterprises (SMEs) or formal corporate managers, leaving the university student population under-studied [7]. Many students enter higher education with poor quantitative backgrounds, yet they are immediately expected to manage budgets, fund living expenses, and evaluate student or personal loans [3], [10], [13]. This mismatch creates an operational deficit: despite high academic engagement in their respective disciplines, students frequently demonstrate inconsistent Financial Decision-Making (FDM) [4]. They struggle to optimize credit facilities, establish structured savings, or engage in long-term asset accumulation [4]. This study addresses this gap by investigating the direct empirical link between ML and FDM among Nigerian undergraduates, while controlling for key demographic factors and broader FL.
1.3 Research Questions
I. What is the baseline level of ML and FDM capability among undergraduate students in selected Nigerian universities?
II. To what extent does ML statistically influence the FDM capabilities of these students?
III. How do demographic control variables (age, gender, level of study, and income) alter the relationship between ML and FDM?
IV. Does general FL mediate or moderate the predictive relationship between ML and undergraduate FDM?
1.4 Research Objectives
I. To assess the current baseline of ML and FDM competence among undergraduate students within selected Nigerian universities.
II. To determine the direct empirical impact of ML on FDM behavior.
III. To evaluate the compounding or confounding influence of age, gender, level of study, and income on students' financial choices.
IV. To model the structural interaction between ML, general FL, and FDM.
1.5 Theoretical Framework
This study is theoretically grounded in the Human Capital Theory popularized by Becker [14], alongside the Dual-Process Theory of cognitive psychology [15].
Human Capital Tsheory: Posits that individuals make deliberate investments in skills, knowledge, and cognitive capabilities to maximize their lifetime utility and economic productivity [14]. ML is conceptualized here as a core quantitative human capital asset. When acquired through formal education, this asset yields microeconomic returns by reducing information asymmetries and lowering transaction costs in personal asset allocation [5].
Dual-Process Theory: Helps explain how these decisions are made. It suggests that financial behavior is governed by two cognitive systems: System 1 (fast, automatic, and intuitive) and system 2 (slow, deliberative, and logical) [15]. FDM often defaults to intuitive system 1 heuristics, which can lead to behavioral biases [12]. ML acts as an anchor for system 2 processing, giving students the analytical tools needed to override impulsive impulses with rational, mathematically validated choices.
2. Materials and Methods
2.1 Research Design
This study adopts a rigorous ex-post quantitative research design utilizing cross-sectional survey methodology. The ex-post approach is appropriate because the independent variable ML and the confounding demographic attributes have already been manifested within the subjects and are not subject to direct experimental manipulation. By employing a structured econometric framework, the study seeks to identify statistical associations and predictive pathways among the variables.
2.2 Population and Sampling Technique
The target population comprises full-time undergraduate students enrolled across selected public and private universities in Nigeria, capturing diverse socio-economic backgrounds and institutional cultures [9].
A multistage sampling technique was used to select respondents:
I. Stratification: Universities were stratified by ownership type (public/federal vs. private) to account for variations in student income levels and institutional resources.
II. Purposive sampling: Selected specific faculties (e.g., social sciences, management sciences, humanities, and natural sciences) to ensure a balanced mix of students with varying levels of quantitative exposure [10]. III. Simple random sampling: Used within the selected departments to select individual respondents, ensuring every student had an equal probability of inclusion.
The sample size was determined using Cochran’s classical formula for infinite populations:
Z . p. q n = … … … … … … … … … … … .1.
where:
I. Z = 1.96 (at a 95% confidence interval).
II. p = 0.5 (maximum variability assumed within student financial behaviors).
III. q = 1 - p = 0.5.
IV. e = 0.05 (acceptable margin of error).
This yielded a baseline minimum sample size of approximately 384. To account for non-response bias and incomplete surveys, the sampling target was increased to 500 respondents.
2.3 Variables and Operational Definition
The variables analyzed within this empirical model are systematically detailed and operationalized in Table 1 below.
Table 1. Operational definition and measurement of variables.
This table is shown in the PDF version of the article.
2.4 Research Instrument and Reliability
Data collection was executed using a closely structured, self-administered questionnaire titled the ML and FDM Assessment Questionnaire (MLFDAO). The instrument was divided into clear modules for demographics, quantitative problem-solving tests ML, conceptual financial knowledge checks FL, and self-reported behavioral items FDM.
To ensure internal consistency and reliability, a pilot study was conducted using 10% of the total sample size (n=50) outside the final target universities. The collected pilot data was subjected to Cronbach’s Alpha (α) reliability analysis. Table 2 outlines the reliability values computed for each main multi-item psychometric index.
Table 2. Psychometric reliability analysis of scales.
This table is shown in the PDF version of the article.
Both values exceed the standard psychometric threshold of 0.70 [6], confirming the instrument's reliability for full deployment.
2.5 Model Specification
To evaluate the empirical relationship between the variables, a multiple linear regression framework was constructed. The baseline structural configuration is expressed as follows:
FDMi = β0 + β1MLi + β2FLi + β3Agei + β4Geni + β5Levi + β5Inci + ɛ1,
where:
I. FDMi: FDM composite index score for student i.
II. MLi: ML raw assessment score for student i.
III. FLi: FL framework mastery index score for student i.
IV. Agei: Age of the respondent.
V. Geni: Gender dummy variable (1 = male, 0 = female).
VI. Levi: Level of Study ordinal rank value.
VII. Inci: Estimated monthly disposable income proxy.
VIII. β0: Intercept constant value.
IX. β1 … … … … … … … … … . β6: Partial regression coefficients to be estimated.
X. ɛ1: Stochastic error term capturing unobserved idiosyncrasies.
A priori expectations dictate that β1 > 0 and β2> 0, indicating that higher mathematical competence and better financial knowledge should lead to more rational and optimal financial choices.
3. Analysis and Discussions
3.1 Descriptive Statistics
A summary of the sample's primary demographic characteristics and baseline variable scores indicates distinct trends within the study cohort. Out of the 500 questionnaires distributed, 472 were recovered completely intact, representing a 94.4% valid response rate. The descriptive distribution of the continuous and ordinal variables gathered from the cohort is organized in Table 3.
Table 3. Descriptive statistics for study variables (N=472).
This table is shown in the PDF version of the article.
The mean score of 5.24/10 suggests moderate ML across the broad student population, with noticeable performance gaps in calculating compound interest and inflation adjustments [5]. Monthly income data showed high variance, ranging from small parental stipends (≈N5,000) to substantial support or independent business revenues exceeding N 180,000 per month. Gender distribution is relatively balanced, with 53% male respondents (n=250) and 47% female respondents (n=222).
3.2 Regression Results and Inferential Data Analysis
The structural model was estimated using Ordinary Least Squares (OLS) regression analysis. Diagnostic checks were conducted prior to extraction: Heteroskedasticity was adjusted using White’s robust standard errors, and the maximum Variance Inflation Factor (VIF) registered at 1.42, confirming the complete absence of multicollinearity threats. The complete regression metrics are detailed in Table 4.
Table 4. OLS linear regression results.
This table is shown in the PDF version of the article.
*Note: The raw coefficient for monthly income reflects scaling per N1,000 units to ensure readability. Dependent variable: FDM Index
3.3 Visual Analysis Component (Indicative Outlines)
To verify the structural integrity and layout of the model visually, two graphical elements should be integrated into the final layout:
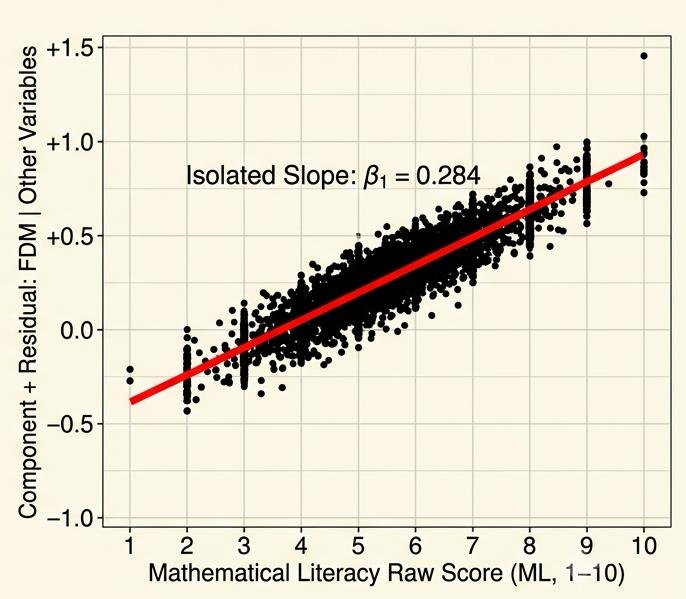
Fig. 1 provides a visual diagnostic of the overall performance and structural fit of the multiple linear regression model (R2 = 0.812).
I. Linear clustering and model fit: The horizontal axis plots the model’s predicted (fitted) values for the FDM index, while the vertical axis represents the actual observed indices from the 472 undergraduate respondents. The strong, tight clustering of data points around the diagonal red line indicates that the model successfully explains a substantial portion (81.2%) of the variation in student financial behavior.
II. Error distribution: The relatively uniform dispersion of points across the entire predictive range demonstrates stable variance (homoskedasticity), confirming that the model’s predictions are reliable across different levels of baseline capability without systematically under- or overestimating specific student subgroups.
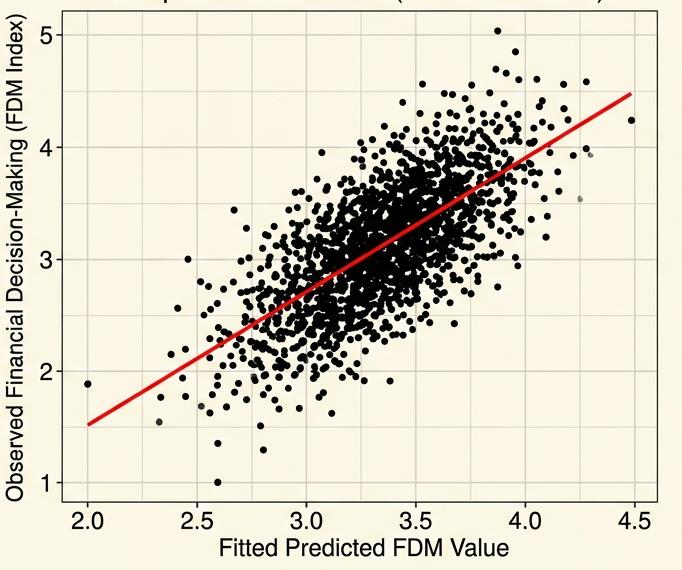
Fig. 2 isolates the distinct, independent relationship between a student’s ML raw score and their FDM capability, while holding all other control variables (such as FL, income, level, and gender) constant.
I. Visualization of the direct effect: The slope of the solid red line represents the estimated regression coefficient (β1= 0.284). This provides clear visual evidence that as a student's actual quantitative capability increases from a score of 1 through 10, their FDM performance improves linearly and significantly (p < 0.001).
II. Theoretical alignment: The continuous upward trend supports the Dual-Process theory within the study's framework. The clear positive slope demonstrates that higher mathematical literacy provides the precise cognitive toolkit needed to transition from instinctive, often biased choices (system 1 heuristics) to structured, analytical, and mathematically sound financial decisions (system 2 logical processing).
A line graph visually isolating the distinct slope of β1= 0.284. This demonstrates how financial decision scores rise linearly alongside actual quantitative performance indicators, supporting the System 2 processing path proposed by Dual-Process Theory.
3.4 Discussion of Empirical Findings
The empirical results offer several key insights into the factors driving undergraduate FDM in Nigeria:
3.4.1 The impact of mathematical literacy (β1 = 0.284, p < 0.001)
This highly significant positive coefficient confirms that mathematical literacy is a strong predictor of sound FDM. Holding all other factors constant, a 1-unit increase in a student's quantitative assessment score leads to a 0.284-unit improvement on the FDM scale. This finding underscores that abstract financial awareness is rarely effective without basic quantitative skills [5]. Students who can accurately perform interest and probability calculations are systematically less susceptible to predatory lending practices and impulsive over-indebtedness [12].
3.4.2 The role of financial literacy (β2 = 0.195, p < 0.001)
As expected, general FL also shows a positive and significant relationship with optimal FDM, matching findings from classical studies [17]. However, the lower standardized coefficient (β* = 0.231) relative to mathematical literacy (β* = 0.382) suggests that conceptual knowledge (e.g., simply understanding what a stock or bond is) is reinforced when paired with the analytical skills needed to evaluate those choices [5].
3.4.3 Influence of socio-demographic control variables
I. Age (p = 0.424): Age did not show a statistically significant independent effect within this sample. This lack of significance is likely due to the relatively narrow age distribution typical of undergraduate populations [18]. II. Gender (β = 0.085, p = 0.006): The regression indicates a small but statistically significant gender effect, with male undergraduates scoring slightly higher on the FDM scale. This aligns with existing literature on gender gaps in financial confidence, often driven by differing socialization patterns regarding risk and asset management [3], ; Speelman et al., 2013).
III. Level of study (β = 0.044, p = 0.015): Academic seniority has a positive, significant coefficient. This suggests that as students progress through the university system, general cognitive maturity and extended independence improve their financial management practices [10].
IV. Income (β= 0.003, p = 0.003): Higher personal disposable income has a positive and significant relationship with decision-making quality. This indicates that students with more stable financial resources have more opportunities to practice active financial planning and asset allocation, reducing short-term cash flow shocks [16].
4. Conclusion and Recommendations
This study investigated the empirical relationship between mathematical literacy and FDM among undergraduate students in Nigerian universities. The findings show that mathematical literacy is a foundational cognitive asset that significantly influences how youth navigate financial choices [5]. Conceptual FL is valuable [6], but its practical application depends heavily on a student's ability to process numerical data, compute compound returns, and assess risks [5].
Socio-demographic factors like higher disposable income, male gender, and greater academic seniority also contribute to better financial choices [18]. However, quantitative capability remains an essential driver. Leaving these quantitative skills undeveloped risks creating a generation of graduates who are formally educated but financially vulnerable, struggling to manage personal wealth or navigate an increasingly complex financial environment [8], [9].
4.1 Recommendations
Based on these findings, the following recommendations are proposed to improve financial outcomes for Nigerian undergraduates:
I. Curriculum integration: The National Universities Commission (NUC) should update the compulsory General Studies (GST) curriculum to merge basic mathematical literacy with practical personal finance modules. This instruction should focus on real-world applications, such as calculating debt amortization schedules, analyzing inflation metrics, and evaluating fintech investment risks.
II. Targeted financial inclusion workshops: Universities should partner with financial institutions and non-interest banking organizations to offer targeted workshops. These initiatives should emphasize experiential learning and quantitative financial planning, with specific outreach designed to support female undergraduates and close existing gender gaps in financial confidence.
III. Digital tools and FinTech support: Higher education stakeholders should encourage the adoption of user-friendly financial budgeting apps and diagnostic software tools on campuses. Providing students with accessible resources to visualize compound interest and manage personal cash flows can help reinforce long-term savings habits.
IV. Policy focus on financial wellness: University administrations should establish financial advisory desks within student affairs units. Providing accessible guidance on budgeting, part-time income management, and debt avoidance can help protect students from predatory digital lending platforms.
Conflict of Interest
The authors certify that they have no affiliations with or involvement in any organization or entity with any financial or non-financial interest in the subject matter discussed in this manuscript.
Data Availability
All data relevant to this study are contained within the manuscript. Additional information is available from the corresponding author upon reasonable request.
Funding
The authors received no financial support for the research, authorship, and/or publication of this article. This work was completed without external funding.
References
- [1] Remund, D. L. (2010). Financial literacy explicated: The case for a clearer definition in an increasingly complex economy. Journal of consumer affairs, 44(2), 276–295. https://doi.org/10.1111/j.1745-6606.2010.01169.x
- [2] Atkinson, A., & Messy, F.-A. (2012). Measuring financial literacy: Results of the oecd/international network on financial education (INFE) pilot study. OECD working papers on finance, insurance and private pensions (pp. 1–73). OECD Publishing. http://dx.doi.org/10.1787/5k9csfs90fr4-en
- [3] Chen, H., & Volpe, R. P. (1998). An analysis of personal financial literacy among college students. Financial services review, 7(2), 107–128. https://doi.org/10.1016/S1057-0810(99)80006-7
- [4] Grable, J. E., & Joo, S. (1999). Financial help-seeking behavior: Theory and implications. Journal of financial counseling and planning, 10(1), 14–25. https://fpperformancelab.org/wp-content/uploads/Financial-Help-Seeking-Behavior-Theory-And-Implications.pdf
- [5] Skagerlund, K., Lind, T., Strömbäck, C., Tinghög, G., & Västfjäll, D. (2018). Financial literacy and the role of numeracy–How individuals’ attitude and affinity with numbers influence financial literacy. Journal of behavioral and experimental economics, 74, 18–25. https://doi.org/10.1016/j.socec.2018.03.004
- [6] Huston, S. J. (2010). Measuring financial literacy. Journal of consumer affairs, 44(2), 296–316. https://doi.org/10.1111/j.1745-6606.2010.01170.x
- [7] Obayori, J. B. (2020). Financial inclusion and economic growth in Nigeria. Business perspective review, 2(2), 46–56. https://doi.org/10.38157/business-perspective-review.v2i2.149
- [8] Williams, H. T., Adeoye, O. O., Olasupo, S. F., & Afolabi-Ojo, A. (2024). Financial literacy and recent financial reforms: A panacea for sustainable development in Nigeria. Adeleke university journal of business and social sciences, 4(1), 116–131. https://aujbss.adelekeuniversity.edu.ng/index.php/aujbss/article/view/100
- [9] Akinyede, O. M., Owolabi, A., & Akinola, A. (2017). Financial literacy and money management among tertiary institution students. A study of selected universities in Osun-State, Nigeria. https://staff.run.edu.ng/oermedia/18777250635131.pdf
- [10] Idika, E., & Udoye, I. (2022). Financial literacy awareness level of Economics Education students in Tertiary institutions. Internation journal of economics education research (IJEER), 5(1), 65–80. http://iafee.org/wp-content/uploads/2023/06/UPDATED-Idika-and-Udoye-IJEER-Vol-5-pp-65-80.pdf
- [11] Ibrahim, M. A., Suleiman, Y., & Jamiu, Y. A. (2025). Entrepreneurial Programmes and Self-employment Intention Among Undergraduates. Philosophy of entrepreneurship: Intersections and insights, 237–252. https://d1wqtxts1xzle7.cloudfront.net/123613161/Philosophy_of_Entrepreneurship_Intersections_and_Ins ights.pdf?1751717000
- [12] Park, C. W., Mothersbaugh, D. L., & Feick, L. (1994). Consumer knowledge assessment. Journal of consumer research, 21(1), 71–82. https://doi.org/10.1086/209383
- [13] Yusuf, J. A., & Ibrahim, M. A. (2026). Navigating the digital frontier: A systemic analysis of the economic, managerial, and societal dimensions of digital transformation in nigerian higher education. Journal of ict and education, 1(1), 75–82. https://doi.org/10.69739/jicte.v1i1.1566
- [14] Becker, G. S. (1975). Human capital: A theoretical and empirical analysis, with special reference to education. (New York: Columbia University). https://press.uchicago.edu/ucp/books/book/chicago/H/bo3684031.html
- [15] Sulphey, M. M. (2014). Behavioural finance. PHI Learning Pvt. Ltd. https://press.uchicago.edu/ucp/books/book/chicago/H/bo3684031.html
- [16] Joo, S., & Grable, J. E. (2004). An exploratory framework of the determinants of financial satisfaction. Journal of family and economic issues, 25(1), 25–50. https://doi.org/10.1023/B:JEEI.0000016722.37994.9f
- [17] Lusardi, A., & Mitchell, O. S. (2011). Financial literacy around the world: An overview. Journal of pension economics and finance, 10(4), 497–508. https://doi.org/10.1017/S1474747211000448
- [18] Garg, N., & Singh, S. (2018). Financial literacy among youth. International journal of social economics, 45(1), 173–186. https://doi.org/10.1108/IJSE-11-2016-0303